
Benchmarks
GitHub Actions (4 vCPU), Docker, 2 CPU and 2 GiB per panel, PostgreSQL 17 (1 CPU) each, 1,000 users, 32 concurrent clients. Median of 3 20 s runs. Remnawave 3.4.5.
- Remnawave 3.4.5 (
remnawave/backend:3.4.5) versus GoWave at commit349f8ed. - Run on GitHub Actions on a runner with 4 vCPU (AMD EPYC 7763) and 16 GB RAM. Logs, raw results and the workflow are public, so the run can be repeated.
- Docker, each panel limited to 2 CPU and 2 GiB, each with its own PostgreSQL 17 on 1 CPU and identical settings. Remnawave also gets Valkey (0.5 CPU), which it requires.
- The same data, created through each panel’s API: 1,000 users, 20 hosts, a profile and a squad.
- Load is generated by k6 1.6.1: each iteration is one HTTP request. Responses are validated: an error, an empty subscription or HTML counts as a failure.
- Run order alternates and is shuffled; every run has a warmup. Each run lasts 20 seconds, three repetitions, tables show the median.
- Before every run both panels’ databases get
CHECKPOINTandVACUUM ANALYZE, so one run does not slow down the next. - Latency is server response time (k6
timings.duration); p99 is the median across runs.
Throughput
Section titled “Throughput”Concurrency mode: a fixed number of clients send requests back to back, each one right after the previous response. This shows how many requests per second a panel actually sustains.
| Workload | Clients | GoWave, requests/s | p99, ms | Remnawave, requests/s | p99, ms | GoWave / Remnawave |
|---|---|---|---|---|---|---|
| Reads (mix) | 1 | 472 | 4.0 | 282 | 7.1 | 1.67× |
| Reads (mix) | 8 | 1,084 | 15.8 | 573 | 38.4 | 1.89× |
| Reads (mix) | 32 | 1,169 | 62.6 | 555 | 122.0 | 2.11× |
| Reads (mix) | 128 | 1,181 | 254.1 | 553 † | 556.8 | 2.14× |
| Subscriptions | 1 | 270 | 4.6 | 225 | 4.8 | 1.20× |
| Subscriptions | 8 | 557 | 25.6 | 370 | 33.4 | 1.51× |
| Subscriptions | 32 | 561 | 109.5 | 400 | 131.1 | 1.40× |
| Subscriptions | 128 | 555 | 451.6 | 395 † | 579.4 | 1.40× |
| Mixed | 1 | 360 | 4.1 | 251 | 7.0 | 1.44× |
| Mixed | 8 | 779 | 20.5 | 463 | 32.4 | 1.68× |
| Mixed | 32 | 833 | 80.2 | 470 | 134.3 | 1.77× |
| Mixed | 128 | 823 | 359.1 | 475 † | 540.9 | 1.73× |
| Writes | 1 | 495 | 2.7 | 285 | 5.0 | 1.74× |
| Writes | 8 | 1,449 | 11.2 | 634 | 19.8 | 2.28× |
| Writes | 32 | 1,467 | 51.8 | 652 | 76.5 | 2.25× |
| Writes | 128 | 1,450 | 225.7 | 670 | 288.9 | 2.16× |
| User list | 1 | 242 | 4.5 | 157 | 8.6 | 1.54× |
| User list | 8 | 507 | 28.0 | 227 | 76.9 | 2.23× |
| User list | 32 | 508 | 119.1 | 213 | 324.6 | 2.39× |
| User list | 128 | 500 | 513.4 | 211 † | 1,111.8 | 2.38× |
| User detail | 1 | 827 | 1.7 | 564 | 2.6 | 1.46× |
| User detail | 8 | 2,242 | 7.8 | 1,170 | 10.9 | 1.92× |
| User detail | 32 | 2,351 | 32.2 | 1,206 | 40.6 | 1.95× |
| User detail | 128 | 2,333 | 125.2 | 1,193 | 165.3 | 1.95× |
| Dashboard stats | 1 | 663 | 2.1 | 287 | 5.0 | 2.31× |
| Dashboard stats | 8 | 3,046 | 5.5 | 637 | 22.3 | 4.78× |
| Dashboard stats | 32 | 4,155 | 21.1 | 650 | 78.4 | 6.39× |
| Dashboard stats | 128 | 4,303 | 70.7 | 649 | 294.1 | 6.63× |
† marks runs where Remnawave failed the SLO: p99 under 500 ms and under 1% errors.
Latency at a fixed load
Section titled “Latency at a fixed load”Rate mode: exactly 100 or 500 requests per second. Both panels keep up, so the comparison is about response times.
| Workload | Requests/s | GoWave p50 / p99, ms | Remnawave p50 / p99, ms |
|---|---|---|---|
| Reads (mix) | 100 | 1.4 / 4.3 | 3.2 / 8.1 |
| Reads (mix) | 500 | 1.5 / 10.4 | 15.8 / 487.4 |
| Subscriptions | 100 | 2.4 / 5.1 | 2.9 / 7.2 |
| Subscriptions | 500 | 8.3 / 131.8 | 584.3 / 10,000.7 |
Memory and startup
Section titled “Memory and startup”- Memory (median across all runs, whole panel container including workers): GoWave about 60 MiB, Remnawave about 1,036 MiB.
- Startup until the first authenticated API response (median of 10 trials): GoWave 209 ms, Remnawave 7.1 s.
Worth knowing
Section titled “Worth knowing”- Dashboard stats at 32 clients and more (up to 6.4×) comes from coalescing concurrent requests: while one computation runs in the database, the others wait for its result. Such a stampede on one endpoint is rare; the everyday difference shows with a single client: 2.3×.
- Writes from 32 clients up are limited by GoWave’s PostgreSQL, not by the application: the database, capped at 1 CPU, is throttled in 81-85% of periods, the panel container is not.
- Nodes are not part of the test. Node management, traffic collection, HWID and real VPN clients were not measured, only the panel API.
- This is a shared GitHub Actions virtual machine, not a capacity study: the active panel, its database and k6 share 4 cores, and runs are short. The numbers show the ratio, not absolute limits.
All charts
Section titled “All charts”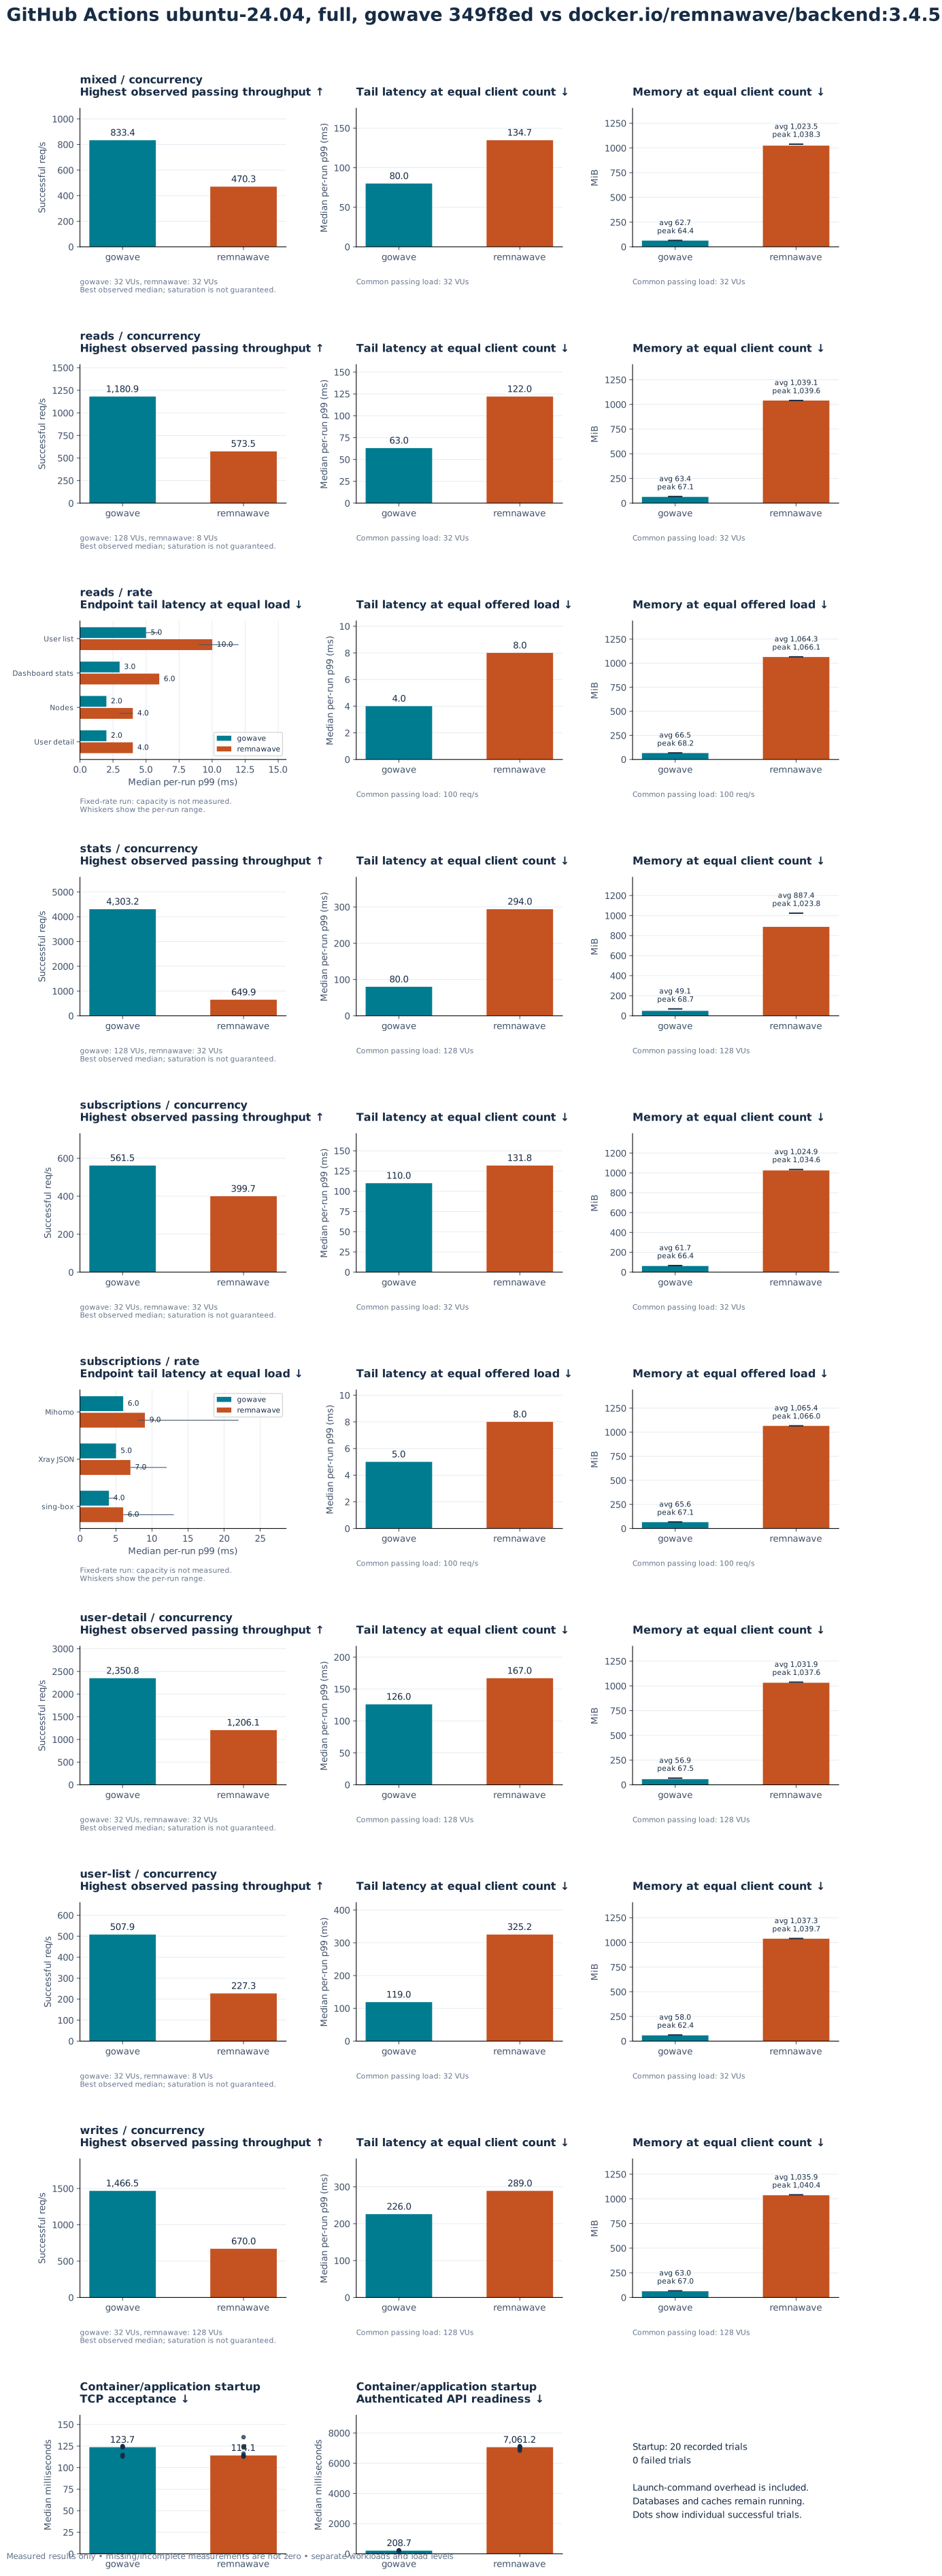
Where the numbers come from
Section titled “Where the numbers come from”The tests live in the public gowave-bench repository: k6 scenarios, both panels in Docker, data preparation and charts. Runs happen on GitHub Actions: the workflow builds GoWave from source, pulls the Remnawave image and compares them on the same virtual machine.
Every run’s logs, machine details and raw results (in the artifacts) are public. The numbers on this page come from run 40386568113. To check them, fork the repository and run the Benchmark workflow with the full profile.